How Many Campaigns Are Too Many: Seeking the Magic Number
December 7, 2017As he’s clicking the ‘send’ button, every marketer wonders– is this the one campaign that will bring back my churned customers, or is this the one that could cause my unsubscribe rates to soar? These 5 steps will help you decide
One of the toughest quandaries every marketer faces is deciphering the number of campaigns they need to send to their customers: What should the frequency look like? What amount will produce the best results?
To start answering these questions, we should first understand where they originate from: sending out a large bundle of campaigns may cause the exact opposite reaction from the desired result – serving as a distraction. The ideal case is that each campaign is impactful, but for marketers, it’s a delicate balance. Campaign bombardment can lead to a reduction in the campaign status and can cause lower open rates.
The customer will become annoyed, and you’ll lead them to the one place you don’t want them to go – the unsubscribe button, that’s where you lose them, oftentimes for good.
To try and mitigate this dilemma, we will need to dive deep into our data in order to better understand our customers behavior and feelings. In these 5 steps, we’ll try to help you reach this magical number – the optimal number of campaigns
Step 1: Definition
Let’s define the variables we want to examine:
Campaign: what is a campaign, and what purpose does it serve? Does SMS fall under this category? What about push notifications? Or, do we only want to test our email program? It’s important to stress that defining the campaign means studying every email sent out to a specific customer. Hence – sending 10K identical messages to 10K customers, is 10K different entities.
Period of Time: this term also derives from the question posed earlier. Is the aim figuring out how many campaigns we need to send during a week? 10 days? A month? Take notice in our examples that will follow, that the time period is not set according to a calendarial term. As such, seven days is a week, no matter which day we began counting. We think of a customer who received three campaigns (on Saturday, Sunday and Monday), as a customer who received three campaigns in a row, although technically, they were delivered on two different calendarial weeks.
Maximum Break Between Two Campaigns: defining this term will allow us to establish what a sequence is. We can decide to leave this term empty – hence, there’s no consideration on the maximum break between campaigns. On the other hand, we can set the number to 1, determining that any campaigns sent in a row one right after the other will be considered consecutive campaigns.
Using this set of characterizations, we can map and define every sent campaign by looking back at the time period we set and the number of campaign sent before. Here are some simple examples:
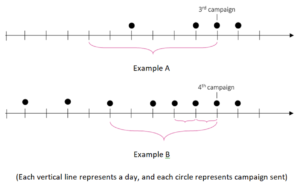
In example A, the time period is seven days, with no set maximal break between campaigns.
In example B, the time period is six days, but the maximal break is 1. Therefore, although the campaign is the 5th during these 6 days period, it’s the 4th that answers our maximal break scenario.
Response: to define the effectiveness of a campaign, we need to establish what constitutes as successful. Is it opening the email, placing a deposit, or having an active day on the site? This must be a binary answer – yes or no questions and responses. In most cases, the response will be measured on the specific day the campaign was sent out. In the example we’ll show, the response was set as day of activity.
These definitions need to be well established, as they will help us come to more fundamental answers during our research. For this piece, all our testing will be based on example A.
Step 2: Mapping
The mapping process isn’t simple, and it’s quite technical. In this stage we define each campaign according to the definitions we set in step 1. After mapping them, we will look for a response from the customer. At the end of this basic process, we can check the division of the various types of executed campaigns, and conclude the response rates (simply divide the amount of “positive responses” with total amount of sent campaigns). You can also create this analysis from simple division using criteria such as – age, country, VIP level, lifecycle stage etc.
In the table below, we see a benchmark of 12 gaming sites (17 million emails), dated from the beginning of 2017. In this case, there was a second division of customers while they received their campaigns – to new customers and active customers – to better understand the frequency alterations during the different lifecycle stages.
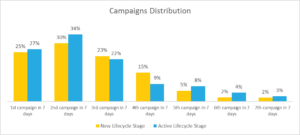
By this mapping, it’s clear that most emails were 2nd campaign types. It’s also obvious that the campaign distribution for the 3rd and 4th campaigns is higher at the ‘New’ lifecycle stage. That’s because the marketing plan is more organized in the new stages of its customers.
Going forward, the next stage is understanding the response rate of different campaigns types. Look at the next table:
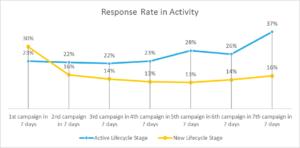
Here we can see the response rate for email campaigns – measuring the active days on when the customer received the campaign. Active customers respond better (26% to 17% on a non-weighted average), except for the first campaign sent, which is significantly higher for new customers.
This graph, which again gathers the data from 12 different brands, doesn’t show substantial changes. When conducting your research, try to look for the main highs and lows, in order to establish your threshold.
Step 3: Different Measures
After formulating the right threshold for each group, we can run the analysis again, while changing the criteria. The final results—that determine the right number to send for each group during a specific time–must be formulated after considering differing variables. And so, even if we see a massive downfall in the response rate of campaigns that are 4th in line, we should combine it into more tests in order to reach a conclusion.
The unsubscribe rate is a good example. A number of irregular campaigns or a high frequency of campaigns can rapidly raise the amount of unsubscribes, and cause some major losses.
This next table shows the unsubscribe benchmarks for different campaign types:
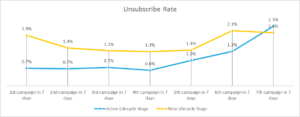
We can see how much higher the unsubscribe rate is in the 1st campaign in seven days, than the campaigns that follow. Again, that is probably supported by the fact that a 1st campaign creates a unique stimulation, and many customers will make their decisions according to this communication. We also notice that the unsubscribe rate for active customers begins to rise considerably after the 5th campaign in seven days. It’s something we will have to take into account when setting our final conclusion.
Step 4: Micro-Segmentation
As stated previously, we wouldn’t want to decide based on groups that are too general. To dive deeper into our customers’ behaviors, we need to create more sub-divisions – to reach more specific groups. Examining different lifecycle stages is always a good way to go, but consider whether any sub-groups that may act differently. Do VIP players need to be tested differently? What about other players with different product preferences?
In the next example, we divided our active customers from the previous benchmarks into different groups, defined by their frequency – the average time (in days) that passed between activities.
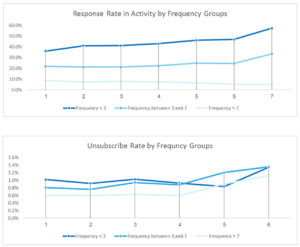
We can see from the first table that active customers who have a high frequency rate (F<3) responded better to numerous and more recurrent campaigns. We can alsosee that customers who are active less frequently (F>7) show a drop-in response rate as the number of campaigns increases.
From the unsubscribed table, we can learn that customers who are less frequent will experience a higher jump in their unsubscribe rates percentages from the 4th campaign on.
Step 5: Conclusion
After executing numerous tests, we can start framing an answer for each group we chose. In an absolute world, all our measurements will point to (?) the same threshold and we could determine the right number of campaigns and their frequencies. But among the results, we will probably encounter some contradictions. We may see a response rate hike on 2nd type campaigns in seven days as well as a rising unsubscribe rate. To settle these types of results we’ll include additional calculations. Always try to choose the right measurement for your needs that will best serve the objective of your target groups. For example: if we look at the ‘active customers who are at risk to churn’ group, the most important measurement for that group is the response rate, as we want them to be more active. As for the ‘active customers with no risk of churn’ group, the crucial measurement is the unsubscribe rate, because we want to be able to contact them.
Once you’ve decided on the numbers of campaigns, implement the frequency results in your marketing programs by creating a test group. Check whether the customers who are receiving the definite number you came up with are responding better than your other customers.
The method suggested here is just one of many, that deals with the important question – how many campaigns should I send and at what frequency? There are additional research methods to incorporate, depending on your data, but try and implement them wisely in order to reach that optimal, yet elusive number.