Interpreting Customer’s Loyalty: There’s Definitely a Logic to Human Behavior
June 8, 2018The world of retail shopping is changing rapidly and with it the level of loyalty of your customers. See what are the changes you should expect, and how to deal with them.
These days, consumerism is not only an inseparable part of our lives, it’s an essence within it. The modern way of living and the vast developments we’ve experienced in the last decade make purchasing an item as easy as reaching your hand forward and tapping once with your index finger.
As the assortment grows and the possibilities are endless, the competition raises. It’s a race for survival for every brand. And the purchasing habits of the new generations – the millennials and even generation Z, whose oldest representatives are now in their twenties – are making sure it will be even harder. When you have tons of brands and products to choose from, and trends are changing all the time, it is quite clear why the issue of customer loyalty is becoming more and more crucial for companies, why they are fighting for every customers, trying to keep them content and happy.
In the following analysis, we tested some of the changes that occurred in recent years in customers’ behavior and what these changes mean to a retail company that wants to keep as many loyal customers as possible. The analysis was based on data gathered from 6 brands with more than 7 million customers.
Number of one-timers
The most basic thing from which we can learn about the current state of customers’ loyalty is the rise of one-timers. One-Timers are customers who bought only once and didn’t return to make another purchase. In order to compare between the different years, we looked at the percent of customers who bought only one time in the six months after their first order, out of all the customers who bought that year. It’s easy to notice a trend – the percent of customers who bought only once in this time period goes up with the years.
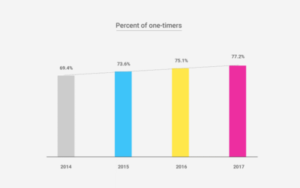
More than that, the uplift between 2014 to 2017 is 13%. That’s a significant number. Another way to notice on this graph is to realize that in 2014 we had 30.6% – almost a third – of customers who bought more than once, while in 2017 it went down to less than a quarter – 22.8%.
The chart below drills down with this data. The left columns show the percent of customers that bought 2 times (all in the six months after their first order), the columns in the middle are customers who bought 3 times, and the right columns show the percent of customers who bought 4 times and more. All, again, by the years.
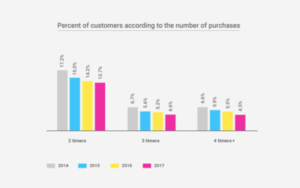
From this table we can learn how customers have a much higher chance to keep buying from a brand after the first purchase, not only a second time but more than that. This strengthens the point of the previous chart we presented – customer loyalty is decreasing. Even the most loyal customers, who have bought 4 times or more, aren’t maintaining their loyalty – a decrease from 6.6% in 2014 to 4.5% in 2017.
Abandoned Shopping Carts
Another good indicator for customers’ loyalty is the customer’s commitment to proceed to actually making a purchase and not just browse the site. The chart below shows the percent of customers who abandoned their shopping cart, meaning they visited the site and the ‘check cart’ page, but then left and did not buy. The percent displayed here is the number of customers who visited their shopping cart but didn’t proceed to complete an order, divided by all the customers who visited the cart page. The customers are divided into age groups, as the age factor is crucial to understanding purchasing power.
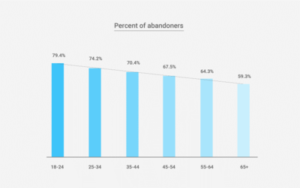
Again, the trend is as clear as can be. In the older segment (Baby Boomers), the chance to abandon the shopping cart is the lowest, and for the younger generation (Gen Z) the chances are the highest. The difference between the two is 20%. There are many reasons for this gap, some from the field of behavioral psychology – from simply the fact that younger people are more indecisive due to the amount of data and options they are familiar with compared to older generations. Another way to interpret this is that the older customers are used to a different, “old time” behavior, when showing your intent to buy really meant something. If someone puts an item into his shopping cart he intends to buy, in compare to the modern way of going into a company’s site to check the options, see what’s new, what’s in style, and then move on to the next site without buying. This is another explanation to how today’s customers and their shopping habits make it harder for companies to maintain customer loyalty.
Survival Rate
Customers’ survival rate represents the number of customers that made at least one purchase in the months following their previous order. In the graph below, the numbers on the horizontal axis are the months after the customer’s first order, and the percentage on the vertical axis is the percent of customers who purchased (out of the all the customers who made a first order one month prior).
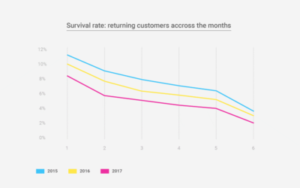
For example, in 2015, 11.3% of customers made a purchase one month after their first order. This number decreased to 8.5% in 2017. When looking at the time span of six months after the first order, the gap between the years is smaller: in 2015, 3.7% returned to buy after six months, compared to 2.2% in 2017. We see that the trend is quite similar in different years, and it makes sense since the chance of making another order a month after our first order is higher than making an order six months after the first one. But here we also see a consistent gap between the years: each year has a lower chance of having returning customers – the survival rate has gone down.
Nowadays, companies have to work harder to gain customer loyalty. As these indicators we presented here show a clear decrease, the companies are suffering by receiving a much lower share of their customers’ wallets. The growing competition, not only in terms of the products themselves but also in terms of buying experience and AI solutions around to make the buying easier and more enjoyable, promises that share of wallet will decrease.
The point here is to make marketers and retailers more aware of these facts and learn how to overcome this obstacle. Companies need to be more attentive to their customers, monitor their actions closely, use campaigns wisely, use more emotional intelligence and basically try harder to get their customers to come back and keep buying.
So, in conclusion, what should you do?
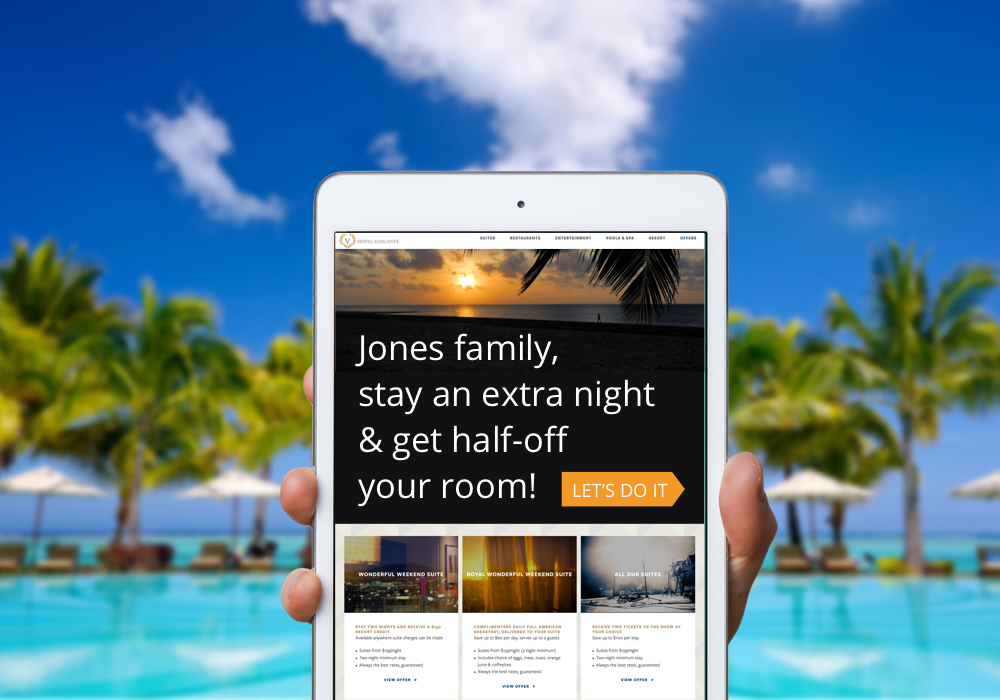
Learn who your customers are – A few things companies can do to keep their customers loyal is making them feel special and treating each customer differently so that the customer won’t be tempted to look in other places, a “we have exactly what you need” strategy. Birthday campaigns, as old as they sound, are usually effective in making the customer feel special and know that you are a company that cares.
Use promotions and offers wisely – Companies tend to give special discounts to new customers to try and make them come back, but returning customers should be rewarded as well, and it is important they are aware of the fact that they are treated differently than others due to their loyalty. One way to do it is to give your loyal customers a special discount – for example, if you are having a big sale, let your loyal customers get the discount one day before the rest, and have “dibs” on the items they want without fearing those items go out of stock. Another way is to give them special offers using promo codes and letting them know they got this discount thanks to their loyalty.
Address their problems – Another example is a customer that is unsatisfied with the order or service he got. It is crucial that the company is aware of that, and is doing their best to handle this customer carefully, and resolves the issue for potential future customers as well.
Find their rhythm – A company must find the right way to communicate with the customer. The first question we need to ask is ‘when is the right time to contact the customer?’ – what time of day, what day of the week and what frequency. It might be every two weeks and maybe once every three months, depending on the customers’ activity. The second question is what channel: some customers never open emails and prefer text messages, others will think text messages are too “pushy”.